Rosalia de Castro's Human Design Chart
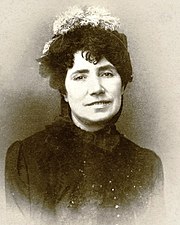
6/2 Sacral GeneratorGalician romanticist writer and poet.
Writing in the Galician language, after the ‘S‚culos Escuros’ (lit. Dark Centuries), she became an important figure of the Galician romantic movement, known today as the ‘Rexurdimento’ (“renaissance”). Her poetry is marked by ‘saudade,’ an almost ineffable combination of nostalgia, longing and melancholy.
The date she published her first collection of poetry in Galician, ‘Cantares gallegos (gl)’ (“Galician Songs”), 17 May 1863, is commemorated every year as the D¡a das Letras Galegas (“Galician Literature Day”), an official holiday of the Autonomous Community of Galicia, and has been dedicated to an important writer in the Galician language since 1963.
Relative poverty and sadness marked her life, although she had a strong sense of commitment to the poor and to the defenseless. She was a strong opponent of abuse of authority and defender of women’s rights. She suffered from cancer of the womb and died of this illness on 15 July 1885, aged 48, in Padr¢n, Galicia, Spain. Her image appeared on the 500 peseta Spanish banknote.
Link to Wikipedia biography
Analyze Rosalia de Castro With AI
Analyze Your Chart With AI
Discover More Famous People
Browse and analyze over 55,000 public figures and celebrities.
Ra Uru Hu
5/1 Manifestor
Martha Stewart
4/6 Manifestor
David Lynch
4/6 Generator
Barack Obama
6/2 Projector
Steve Jobs
6/3 Generator
Vladimir Putin
5/1 Manifestor
Kim Kardashian
3/5 Generator
Michael Jackson
1/3 Projector
Marilyn Monroe
6/2 Projector
Ariana Grande
2/4 Projector
Oprah Winfrey
2/4 Generator
Johnny Depp
2/4 ManifestorBrowse All Famous People
What is HumanDesign.ai and how does it work?
Curious what makes Rosalia de Castro tick? HumanDesign.ai instantly maps their exact birth data into a fully interactive clickable bodygraph chart, letting you hover or tap every center, channel, and gate for plain-language explanations. Bella, the platform’s built-in AI guide, adds context in real time, translating complex mechanics into everyday insights so you can see how Rosalia de Castro’s strengths, challenges, and life themes play out on-screen.
The same tools are waiting for you. Generate your own Human Design Chart in seconds, open a library of 2000+ suggested questions, and chat with Bella as often as you like to decode your design, daily transits, and even relationship dynamics.
Want to compare energies? Save unlimited charts for friends, family, or clients, then ask Bella to reveal compatibilities, composite patterns, or coaching tips, all in one conversation thread.
Start free with core features, or unlock our Personal and Pro plans for deeper dives: unlimited Q&A, celebrity chart search spanning 55,000+ public figures, white-label PDF reports, branded content generation, and a professional profile with built-in booking for practitioners. Whether you’re exploring your own potential or guiding others, HumanDesign.ai delivers an ever-expanding toolbox of AI-powered insights—no spreadsheets, no jargon, just clarity at your fingertips.
Ready to see yours? Signup for FREE today!
Design
Design
Personality
Chart Properties
Decision Making Framework