Gottfried von Cramm's Human Design Chart
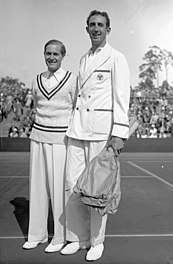
6/2 Emotional Manifesting GeneratorGerman amateur era tennis champion and twice French Open champion. He was ranked World No. 2 in both 1934 and 1936 and World No. 1 in 1937.
The Nazis wanted to exploit his blonde good looks as a symbol of Aryan supremacy, but he refused to identify with Nazism. Probably in revenge, they jailed him for an earlier homosexual relationship with a Jewish actor, and this damaged his career abroad. However, a more probable reason for his imprisonment was because of his losing streak in international tennis; he had lost in the 1937 Davis Cup deciding match to the American Don Budge and Germany did not continue to the finals. In the war, he was discharged from the military because of frostbite.
After the War was over and he was released from captivity, von Cramm resumed his tennis career. He won the German Championships in 1949 at the age of 40 and played his last Grand Slam event at Wimbledon in 1951, where he lost in the opening round to Jaroslav Drobny. Von Cramm became a successful businessman and was tragically killed in a car crash on 8 November 1976 aged 67.
Link to Wikipedia biography
Analyze Gottfried von Cramm With AI
Analyze Your Chart With AI
Discover More Famous People
Browse and analyze over 55,000 public figures and celebrities.
Ra Uru Hu
5/1 Manifestor
Martha Stewart
4/6 Manifestor
David Lynch
4/6 Generator
Barack Obama
6/2 Projector
Steve Jobs
6/3 Generator
Vladimir Putin
5/1 Manifestor
Kim Kardashian
3/5 Generator
Michael Jackson
1/3 Projector
Marilyn Monroe
6/2 Projector
Ariana Grande
2/4 Projector
Oprah Winfrey
2/4 Generator
Johnny Depp
2/4 ManifestorBrowse All Famous People
What is HumanDesign.ai and how does it work?
Curious what makes Gottfried von Cramm tick? HumanDesign.ai instantly maps their exact birth data into a fully interactive clickable bodygraph chart, letting you hover or tap every center, channel, and gate for plain-language explanations. Bella, the platform’s built-in AI guide, adds context in real time, translating complex mechanics into everyday insights so you can see how Gottfried von Cramm’s strengths, challenges, and life themes play out on-screen.
The same tools are waiting for you. Generate your own Human Design Chart in seconds, open a library of 2000+ suggested questions, and chat with Bella as often as you like to decode your design, daily transits, and even relationship dynamics.
Want to compare energies? Save unlimited charts for friends, family, or clients, then ask Bella to reveal compatibilities, composite patterns, or coaching tips, all in one conversation thread.
Start free with core features, or unlock our Personal and Pro plans for deeper dives: unlimited Q&A, celebrity chart search spanning 55,000+ public figures, white-label PDF reports, branded content generation, and a professional profile with built-in booking for practitioners. Whether you’re exploring your own potential or guiding others, HumanDesign.ai delivers an ever-expanding toolbox of AI-powered insights—no spreadsheets, no jargon, just clarity at your fingertips.
Ready to see yours? Signup for FREE today!
Design
Design
Personality
Chart Properties
Decision Making Framework