David Nyhan's Human Design Chart
5/1 Sacral GeneratorAmerican journalist who wrote for the Boston Globe for 32 years covering a wide range of news but concentrating on the political front. He joined the Globe in 1969 covering the state government and retired in June 2001. He served as the newspaper’s Bureau Chief in Washington, DC from 1972-74 covering the Nixon impeachment trial. Nyhan covered other big stories as well including the IRA hunger strikes, the death of Bobby Sands, and nearly every political campaign. In 1988 he wrote a biography of Michael Dukakis entitled, “The Duke.”
Big in stature at 6’4″ he was considered larger than life by the journalistic community as well as in local politics. No friend of then-Cardinal Bernard Law, he was outspoken in his disregard. He wrote speeches for local pols and earned a spot as a pall bearer for Tip O’Neill. His influence helped force the resignation of an editor who was not well regarded at the Boston Globe. He was seen as generous to others striving to make a career in journalism and his candor endeared him to many. He and his wife had three children. He died at age 64 in Boston on January 23, 2005 of an apparent heart attack suffered while shoveling snow.
Link to Wikipedia biography
Analyze David Nyhan With AI
Analyze Your Chart With AI
Discover More Famous People
Browse and analyze over 55,000 public figures and celebrities.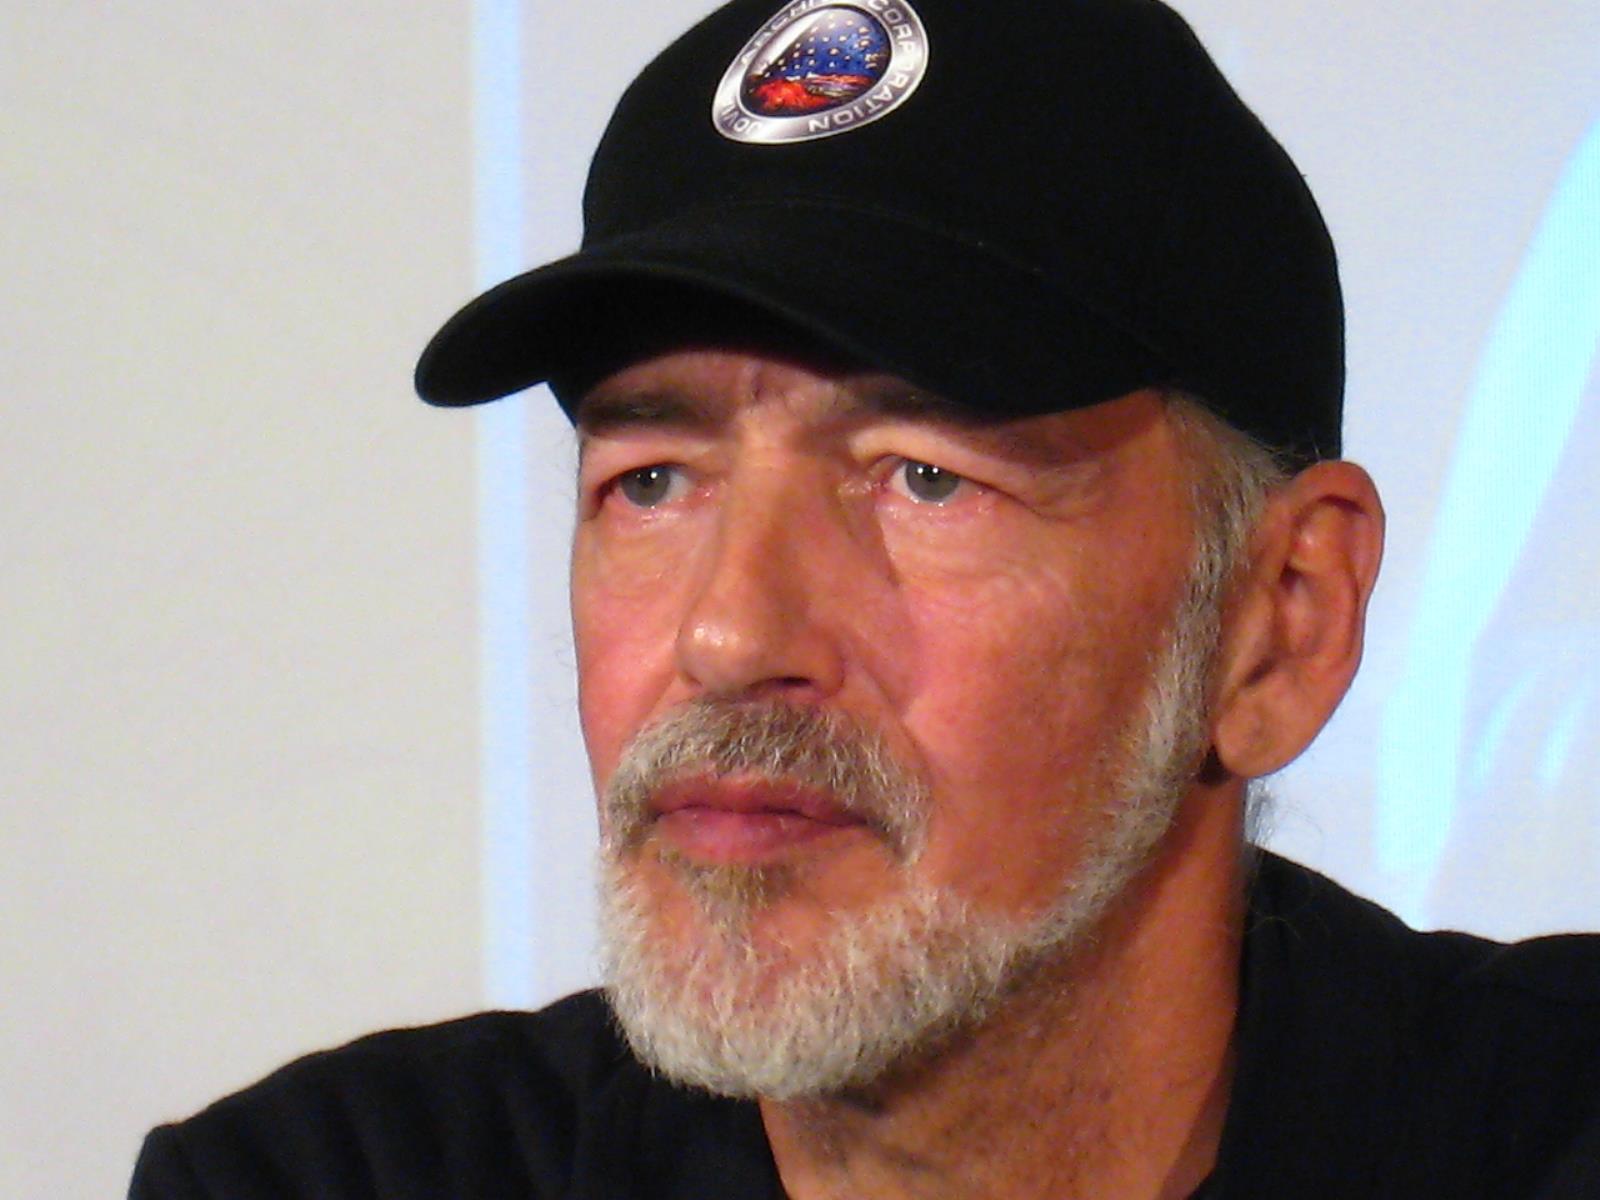
Ra Uru Hu
5/1 Manifestor
Martha Stewart
4/6 Manifestor
David Lynch
4/6 Generator
Barack Obama
6/2 Projector
Steve Jobs
6/3 Generator
Vladimir Putin
5/1 Manifestor
Kim Kardashian
3/5 Generator
Michael Jackson
1/3 Projector
Marilyn Monroe
6/2 Projector
Ariana Grande
2/4 Projector
Oprah Winfrey
2/4 Generator
Johnny Depp
2/4 ManifestorBrowse All Famous People
What is HumanDesign.ai and how does it work?
Curious what makes David Nyhan tick? HumanDesign.ai instantly maps their exact birth data into a fully interactive clickable bodygraph chart, letting you hover or tap every center, channel, and gate for plain-language explanations. Bella, the platform’s built-in AI guide, adds context in real time, translating complex mechanics into everyday insights so you can see how David Nyhan’s strengths, challenges, and life themes play out on-screen.
The same tools are waiting for you. Generate your own Human Design Chart in seconds, open a library of 2000+ suggested questions, and chat with Bella as often as you like to decode your design, daily transits, and even relationship dynamics.
Want to compare energies? Save unlimited charts for friends, family, or clients, then ask Bella to reveal compatibilities, composite patterns, or coaching tips, all in one conversation thread.
Start free with core features, or unlock our Personal and Pro plans for deeper dives: unlimited Q&A, celebrity chart search spanning 55,000+ public figures, white-label PDF reports, branded content generation, and a professional profile with built-in booking for practitioners. Whether you’re exploring your own potential or guiding others, HumanDesign.ai delivers an ever-expanding toolbox of AI-powered insights—no spreadsheets, no jargon, just clarity at your fingertips.
Ready to see yours? Signup for FREE today!
Design
Design
Personality
Chart Properties
Decision Making Framework