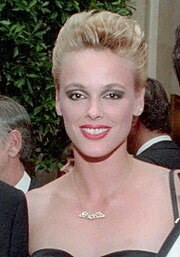
Brigitte Nielsen's Human Design Chart
2/4 Emotional GeneratorDanish actress whose screen credits include: “Red Sonja,” and “Beverly Hills Cop II.” She also did two pictures with Sylvester Stallone, “Rocky IV,” and, “Cobra.” She left her first husband and child to hit the glory trail, using nude photos, with a bosom of 40 DD, as a calling card.
She had a short-lived marriage to Sylvester Stalone, eighteen months; divorced in 1987.
Nielsen had an ardent liaison with football player Mark Gastineau in February 1988 and had his child on 12/12/1989. Four years later, on 12/17/1993, she married Raul Meyer Ortolani at about 6:00 PM in Morcote, Switzerland. They divorced in April 2005 after having two children together. A tough and ambitious lady, she goes to any lengths to get what she wants.
The actress married Italian model Mattia Dessi on July 8, 2006 in Malta. The couple had taken their vows once before, on February 21, 2005 in the Dominican Republic but the marriage had been declared illegal because her divorce from hubby number 4 (Raoul Meyer) hadn’t become final. Dessi, a former model, is 28 years old, nearly 15 years her junior.
Link to Wikipedia biography
Analyze Brigitte Nielsen With AI
Analyze Your Chart With AI
Discover More Famous People
Browse and analyze over 55,000 public figures and celebrities.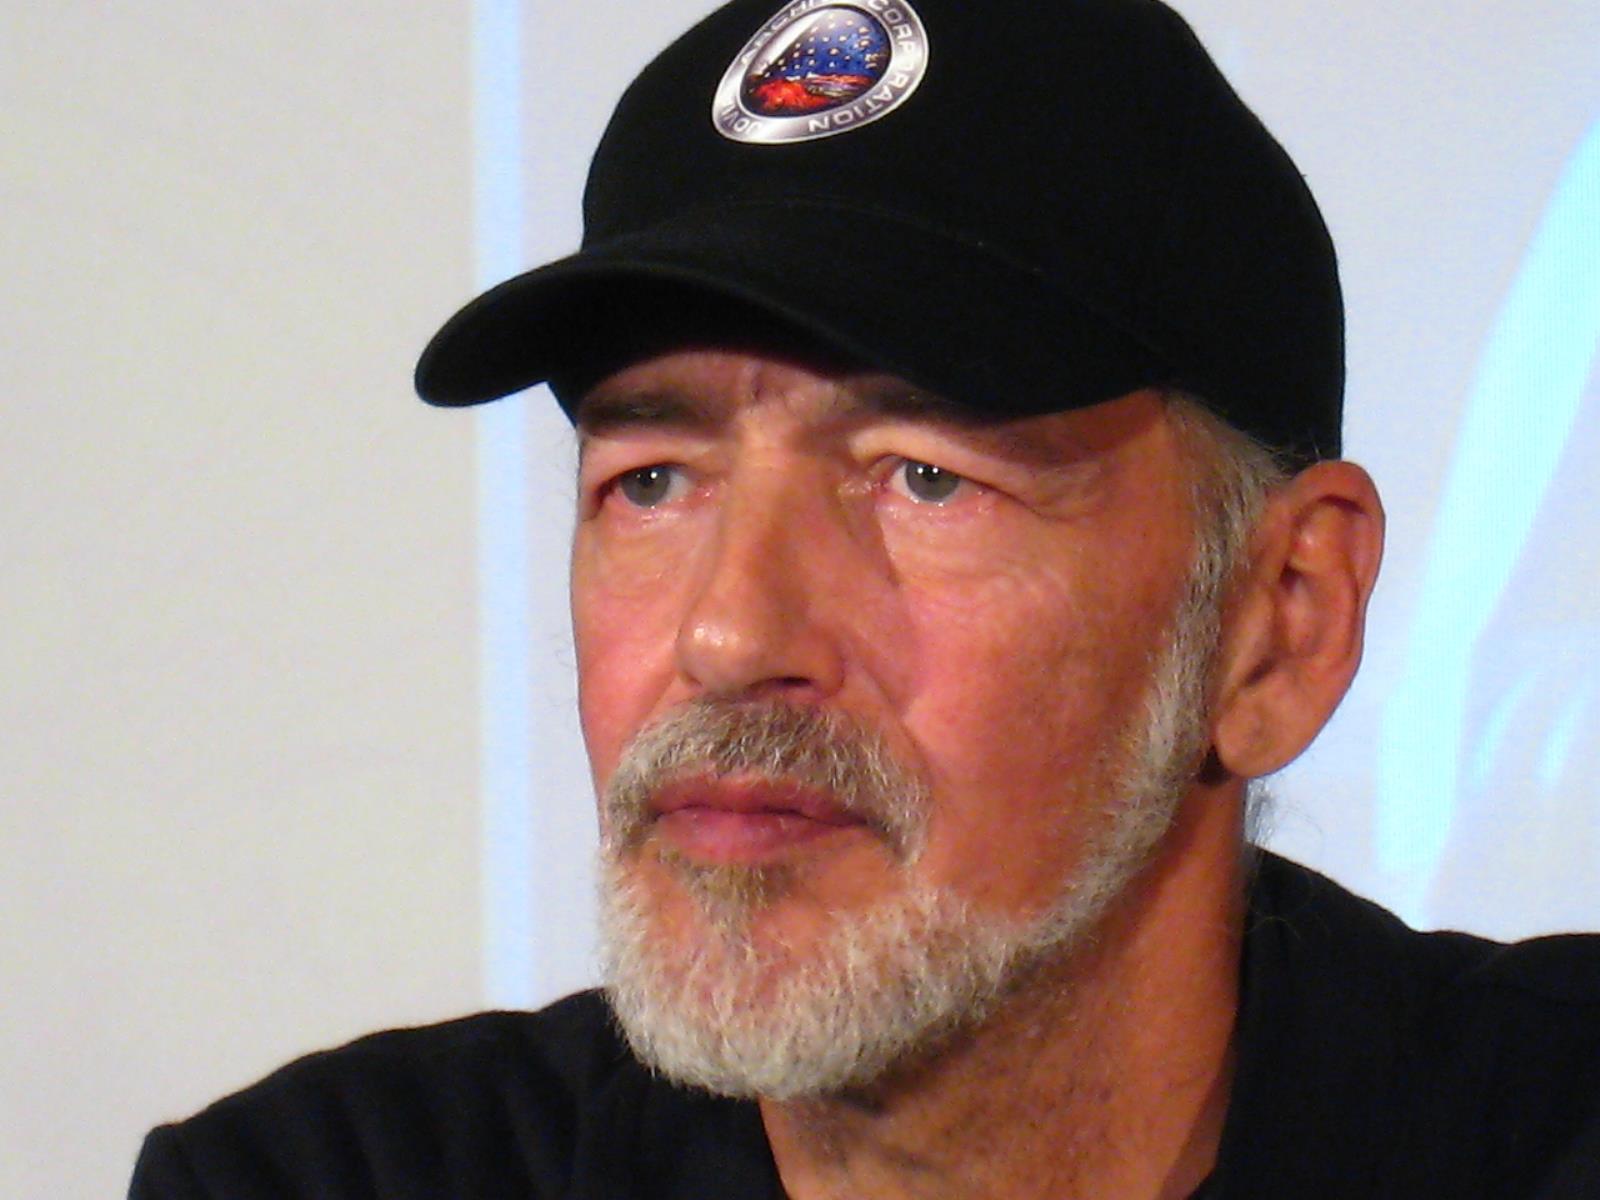
Ra Uru Hu
5/1 Manifestor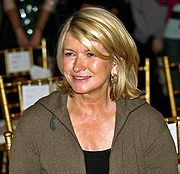
Martha Stewart
4/6 Manifestor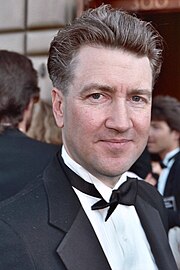
David Lynch
4/6 Generator
Barack Obama
6/2 Projector
Steve Jobs
6/3 Generator
Vladimir Putin
5/1 Manifestor
Kim Kardashian
3/5 Generator
Michael Jackson
1/3 Projector
Marilyn Monroe
6/2 Projector
Ariana Grande
2/4 Projector
Oprah Winfrey
2/4 Generator
Johnny Depp
2/4 ManifestorBrowse All Famous People
What is HumanDesign.ai and how does it work?
Curious what makes Brigitte Nielsen tick? HumanDesign.ai instantly maps their exact birth data into a fully interactive clickable bodygraph chart, letting you hover or tap every center, channel, and gate for plain-language explanations. Bella, the platform’s built-in AI guide, adds context in real time, translating complex mechanics into everyday insights so you can see how Brigitte Nielsen’s strengths, challenges, and life themes play out on-screen.
The same tools are waiting for you. Generate your own Human Design Chart in seconds, open a library of 2000+ suggested questions, and chat with Bella as often as you like to decode your design, daily transits, and even relationship dynamics.
Want to compare energies? Save unlimited charts for friends, family, or clients, then ask Bella to reveal compatibilities, composite patterns, or coaching tips, all in one conversation thread.
Start free with core features, or unlock our Personal and Pro plans for deeper dives: unlimited Q&A, celebrity chart search spanning 55,000+ public figures, white-label PDF reports, branded content generation, and a professional profile with built-in booking for practitioners. Whether you’re exploring your own potential or guiding others, HumanDesign.ai delivers an ever-expanding toolbox of AI-powered insights—no spreadsheets, no jargon, just clarity at your fingertips.
Ready to see yours? Signup for FREE today!
Design
Design
Personality
Chart Properties
Decision Making Framework