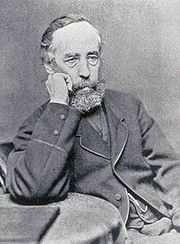
James Croll's Human Design Chart
4/6 Splenic ProjectorScottish scientist who developed a theory of climate change based on changes in the Earth’s orbit.
James Croll was largely self-educated, teaching himself physics and astronomy. At 16 he became an apprentice wheelwright at Collace near Wolfhill, and then because of health problems a tea merchant in Elgin, Moray. He married Isabella Macdonald in 1848.
In the 1850s he managed a temperance hotel and was then an insurance agent in Glasgow, Edinburgh and Leicester, England. In 1859 he became a caretaker in the museum at the Andersonian College and Museum, Glasgow, so as to have access to books to allow him to develop his ideas.
From 1864, Croll corresponded with Sir Charles Lyell, on links between ice ages and variations in the Earth’s orbit. This led to a position in the Edinburgh office of the Geological Survey of Scotland, as keeper of maps and correspondence, where the director, Sir Archibald Geikie, encouraged his research. He published a number of books and papers which “were at the forefront of contemporary science”, including Climate and Time, in Their Geological Relations in 1875. He corresponded with Charles Darwin on erosion by rivers.
In 1876, he was elected Fellow of the Royal Society, and awarded an honorary degree by the University of St Andrews. He retired in 1880 because of ill health, and died on 15 December 1890.
Link to Wikipedia biography
Analyze James Croll With AI
Analyze Your Chart With AI
Discover More Famous People
Browse and analyze over 55,000 public figures and celebrities.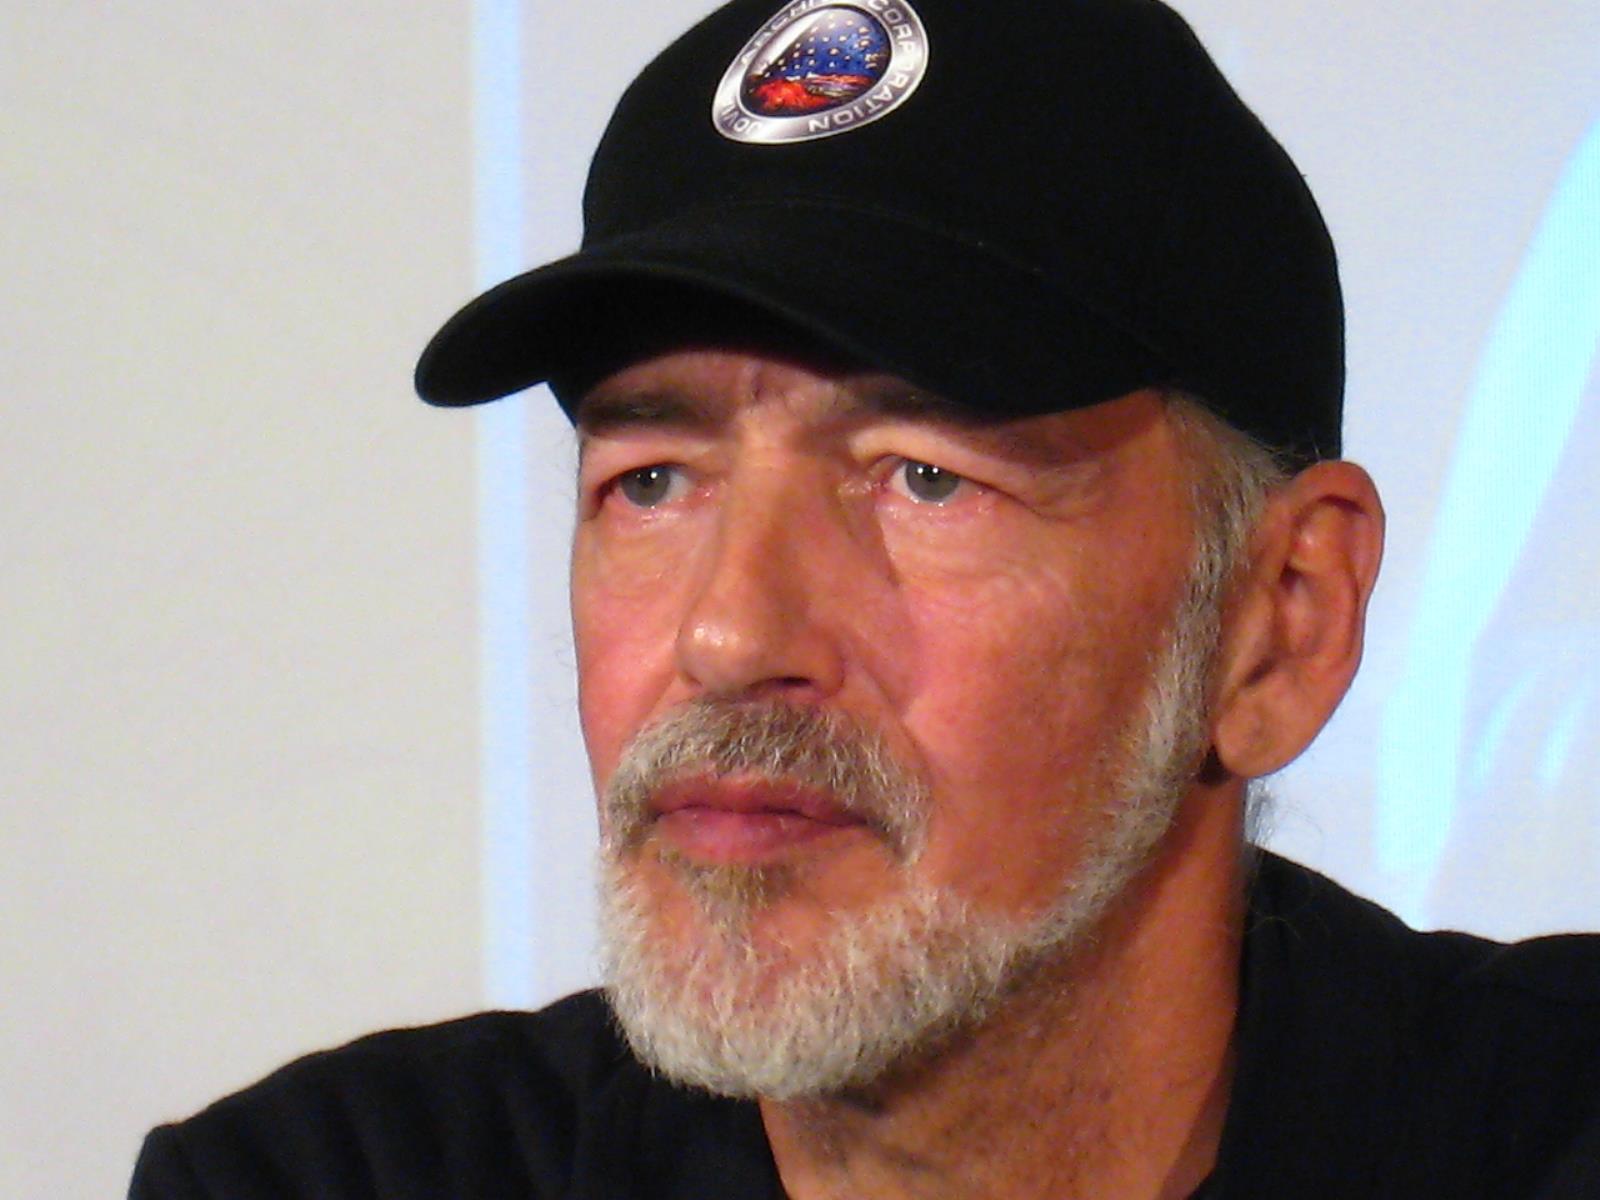
Ra Uru Hu
5/1 Manifestor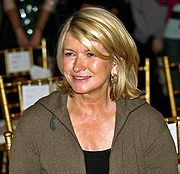
Martha Stewart
4/6 Manifestor
David Lynch
4/6 Generator
Barack Obama
6/2 Projector
Steve Jobs
6/3 Generator
Vladimir Putin
5/1 Manifestor
Kim Kardashian
3/5 Generator
Michael Jackson
1/3 Projector
Marilyn Monroe
6/2 Projector
Ariana Grande
2/4 Projector
Oprah Winfrey
2/4 Generator
Johnny Depp
2/4 ManifestorBrowse All Famous People
What is HumanDesign.ai and how does it work?
Curious what makes James Croll tick? HumanDesign.ai instantly maps their exact birth data into a fully interactive clickable bodygraph chart, letting you hover or tap every center, channel, and gate for plain-language explanations. Bella, the platform’s built-in AI guide, adds context in real time, translating complex mechanics into everyday insights so you can see how James Croll’s strengths, challenges, and life themes play out on-screen.
The same tools are waiting for you. Generate your own Human Design Chart in seconds, open a library of 2000+ suggested questions, and chat with Bella as often as you like to decode your design, daily transits, and even relationship dynamics.
Want to compare energies? Save unlimited charts for friends, family, or clients, then ask Bella to reveal compatibilities, composite patterns, or coaching tips, all in one conversation thread.
Start free with core features, or unlock our Personal and Pro plans for deeper dives: unlimited Q&A, celebrity chart search spanning 55,000+ public figures, white-label PDF reports, branded content generation, and a professional profile with built-in booking for practitioners. Whether you’re exploring your own potential or guiding others, HumanDesign.ai delivers an ever-expanding toolbox of AI-powered insights—no spreadsheets, no jargon, just clarity at your fingertips.
Ready to see yours? Signup for FREE today!